A Million Random Digits
A sonic and visual analysis of A Million Random Digits with 100,000 Normal Deviates
The concept of randomness is fascinating and surprisingly complex to the uninformed. Randomness is a quirky trait to many people, but it is also a concept that is deeply interwined with human culture as fortune tellers and scientists have tried to deconstruct and reconstruct randomness. The introduction of high speed computers have allowed fast generation of pseudorandom numbers and abstracted our perception of randomness in the process. Before this development statisticians produced random number tables to aid them in desiging scientific experiments. A Million Random Digits with 100,000 Normal Deviates, published by the RAND Corporation in 1955, was an important 20th century work in the field of statistics and one of the last random number tables that was created, after which computers took on the task of generating randomness.
Getting the data / Processing it
In this data visualization project, I took a text version provided by RAND. In order to make some sense of the information, I wrote a Python script to parse through the text file and count the number of occurrences of each digit.
#!/usr/bin/env python3

import sys
import time

filepath = 'digits.txt'

digits = []

with open(filepath) as filename:
    line = filename.readline()
    count = 1
    while line:
        d = "".join(line.split())
        for x in range(5,len(d)):
               digits.append(d[x])
        line = filename.readline()
        count+=1

print(len(digits))

def adder():
    num0 = 0
    num1 = 0
    num2 = 0
    num3 = 0
    num4 = 0
    num5 = 0
    num6 = 0
    num7 = 0
    num8 = 0
    num9 = 0

    for x in range(len(digits)):
        d = digits[x].encode()

        print( d)
adder()
Visualizing the Data
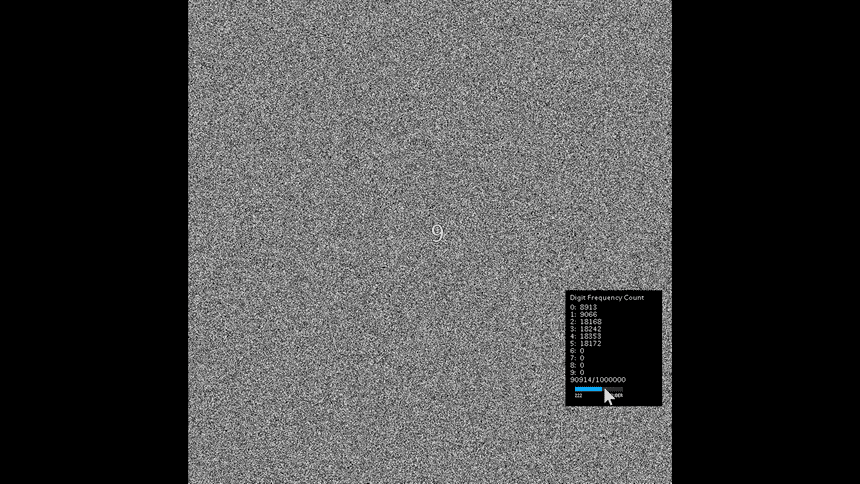
Next, I was interested in other ways to represent the dataset. In order to visualize the numbers, I used Processing to create a 1,000 x 1,000 pixel canvas to store the million pixels. I loaded the text file and scanned through the data, mapping [0,9] to a gray scale value between [0,255] and colored each pixel, making this image:

Sonifying the Data
To push the visualization further, I made a sonic representation of the dataset using the Minim library. I mapped each digit to it's corresponding DTMF tone. Finally, I combined the three parts into a single Processing sketch that showed the dataset and iterated through each digit and played the tone. I kept count of each occurrence and highlighted the current digit. I used sliders to control speed and allowed the user to change the wave form of the sounds.
Final
The code can be found here: github