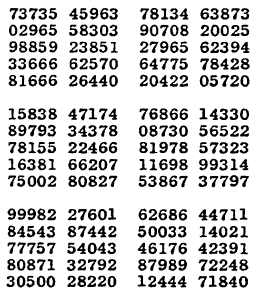
The concept of randomness is fascinating and surprisingly complex to the uninformed. Randomness is a quirky trait to many people, but it is also a concept that is deeply intertwined with human culture as fortune tellers and scientists have tried to deconstruct and reconstruct randomness. The introduction of high speed computers have allowed fast generation of pseudorandom numbers and abstracted our perception of randomness in the process. Before this development statisticians produced random number tables to aid them in designing scientific experiments. A Million Random Digits with 100,000 Normal Deviates, published by the RAND Corporation in 1955, was an important 20th century work in the field of statistics and one of the last random number tables that was created, after which computers took on the task of generating randomness.
A Million Random Digits with 100,000 Normal Deviates was produced starting in 1947. The numbers were generated by a complex multi-step process.
"Briefly, a random frequency pulse source, providing on the average about 100,000 pulses per second, was gated about once per second by a constant frequency pulse. Pulse standardization circuits passed the pulses through a 5-place binary counter. In principle the machine was a 32-place roulette wheel which made, on the average, about 3000 revolutions per trial and produced one number per second. A binary-to-decimal converter was used which converted 20 of the 32 numbers (the other twelve were discarded) and retained only the final digit of two-digit numbers; this final digit was fed into an IBM punch to produce finally a punched card table of random digits." - A Million Random Digits with 100,000 Normal Deviates
The book was a breakthrough in statistics because such a large table had never been available before. The book was republished in 2001 and made available on Amazon where there are many humorous reviews.
I selected this archive of data to reflect on the concept of randomness and as an homage to how the development of computers have changed our perception and experience of the world. I used a variety of data visualization and sonification techniques to illuminate the sacred text of randomness and allow for a playfulness in interacting with a body of abstract data.
In order to do this I downloaded a text copy of the book that the RAND Corporation has made available and made a simple Python script to parse through the text and output a usable JSON file of the data that I could work with. I originally tried to use vanilla Javascript to visualize the data, but I found that the browser struggled handle that amount of data, so I opted to use Processing 3 for the piece since it had a variety of useful libraries that would help.
I created a 1000x1000 canvas to visualize the data set by setting each data point as a single pixel with the brightness mapped from 0-9 to 0-255. As a time based piece I iterate through each number and display the digit while I denote the pixel it is represented by with the color red. Processing tops out at about 120 frames per second, so it would take a little over two hours to view the whole piece. Additionally I provide a frequency counter to aid in understanding the data.
I also employed sonification techniques to accompany the visual representation of the data set. Additionally I provide a frequency counter to aid in understanding the data.
I also employed sonification techniques to accompany the visual representation of the data set. Some researchers advocate for using sonification theorizing that humans ears are better for pattern recognition than visually. I used familar DTMF signaling (touch tone) to map sound to the numbers.
Finally I added a layer of interaction so that the data would be more tangible. I used a slider to control the speed so that viewers can slow or speed up the animation to make the data more readable. I also added a way to change the waveforms of the dual frequencies as to maintain the integrity of the mapped frequencies with the data, but viewers can in a way play with the sound qualities.
In the end I had some fun playing with the representation of the random numbers and I might build a physical component for fun.